
Utah Spending Tracker
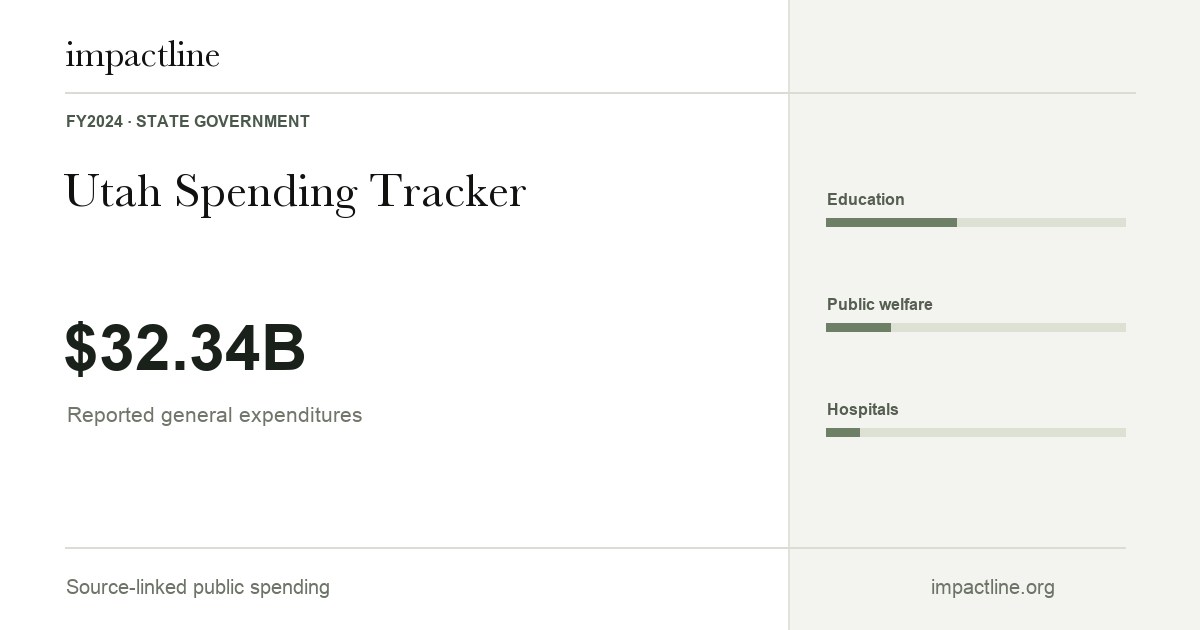
Utah reported $32.34B in general expenditures for Census FY2024. The largest functions were education, public welfare, hospitals. This tracker shows reported financial activity, separately from permission to spend in an enacted budget.
$32,337,388,000 · Census FY2024 · State government only
General expenditures include direct spending and transfers to other governments. They exclude utilities, liquor-store expenditure and insurance-trust payments.
Open the official Census table ↗A source-linked snapshot of this state’s spending.
Preview image ↗
General expenditure ledger
| Function | Reported dollars | Share |
|---|---|---|
| Education | $14,128,104,000 | 43.7% |
| Public welfare | $6,925,387,000 | 21.4% |
| Hospitals | $3,619,580,000 | 11.2% |
| Highways | $2,086,948,000 | 6.5% |
| Other and unallocable | $904,736,000 | 2.8% |
| Financial administration | $795,777,000 | 2.5% |
| Health | $773,897,000 | 2.4% |
| Government administration and buildings | $707,404,000 | 2.2% |
| Corrections | $580,480,000 | 1.8% |
| Natural resources | $508,111,000 | 1.6% |
| Judicial and legal services | $323,892,000 | 1.0% |
| Police protection | $269,767,000 | 0.8% |
| Interest on general debt | $230,722,000 | 0.7% |
| Housing and community development | $164,707,000 | 0.5% |
| Protective inspection and regulation | $121,304,000 | 0.4% |
| Parks and recreation | $118,099,000 | 0.4% |
| General local government support | $44,656,000 | 0.1% |
| Air transportation | $15,443,000 | 0.0% |
| Libraries | $7,118,000 | 0.0% |
| Veterans' services | $6,448,000 | 0.0% |
| Solid waste management | $4,808,000 | 0.0% |
| Miscellaneous commercial activities | $0 | 0.0% |
| Parking facilities | $0 | 0.0% |
| Sea and inland port facilities | $0 | 0.0% |
| Sewerage | $0 | 0.0% |
| Total general expenditures | $32,337,388,000 | 100.0% |
The function groups sum exactly to Census aggregate SF0133 before rounding. Some categories include transfers to local governments; they are not all payments to contractors.
Other reported expenditure measures
SF0132 equals general expenditures plus utilities and liquor stores. Insurance-trust expenditure is separately reported and excluded from both SF0132 and the general-expenditure headline. These measures are displayed to explain coverage; they are not an enacted all-funds budget.
General revenue sources
| Revenue category | Reported dollars |
|---|---|
| Federal intergovernmental revenue | $8,462,642,000 |
| Local intergovernmental revenue | $5,216,000 |
| Taxes | $13,437,832,000 |
| Current charges | $7,286,657,000 |
| Miscellaneous general revenue | $2,445,363,000 |
| Total general revenue · SF0002 | $31,637,710,000 |
Revenue sources are not an appropriation-by-fund chart and do not trace a particular revenue dollar to a particular spending function. Federal transfers received here should not be added again as federal awards to construct a combined spending total.
Official budget documents
Utah Governor's Office of Planning & Budget ↗
Use enacted or approved documents for spending authority. Budget-office resources can also contain proposals, recommendations and amendments; their status and fiscal period must be checked before comparing a figure with this expenditure ledger.
Inspect the budget-resource source notesQuestions about this tracker
How much did Utah state government spend?
The Census FY2024 general-expenditure measure is $32,337,388,000. This excludes utilities, liquor stores and insurance-trust expenditures; the separate measures above show those coverage differences.
Is this the latest enacted budget?
No. This is the latest fiscal year in the retrieved Census state-finance bulk release: FY2024. An enacted budget authorizes spending and requires a separate official state budget source.
Does a large spending category prove fraud?
No. These are accounting records, not audit findings, recipient payment records or evidence of misconduct. Check a specific claim against an audit, contract, payment or documented outcome.
Can I compare two states directly?
You can compare the same Census measure and year, but total dollars do not adjust for population, prices or which level of government provides a service. Transfers and local spending need careful treatment.
Published sources and reproducibility
- Census State Government Finances table · FY2024
- Official Census bulk download · source amounts are thousands of dollars; downloads here normalize them to dollars.
- FY2024 Census methodology and fiscal-period scope
- Source files, hashes and normalization notes
How to read an audit finding · Compare all 50 state governments
Automated data processing and AI-assisted explanatory writing are disclosed. Follow the primary sources to verify each measure. A spending total or missing record does not establish fraud.